Delivering research outcomes via an interactive web hub
To move beyond the limitations of traditional PDF reporting, I developed a high-impact web platform to house complex segmentation research for a client project. The bespoke solution prioritises mobile accessibility and hosts interactive media, videos, and a quiz which bring the data to life in ways a static document doesn't.
By transforming a linear report into a dynamic hub, the platform allows stakeholders to navigate their segments intuitively and engage with the research.
Ideation
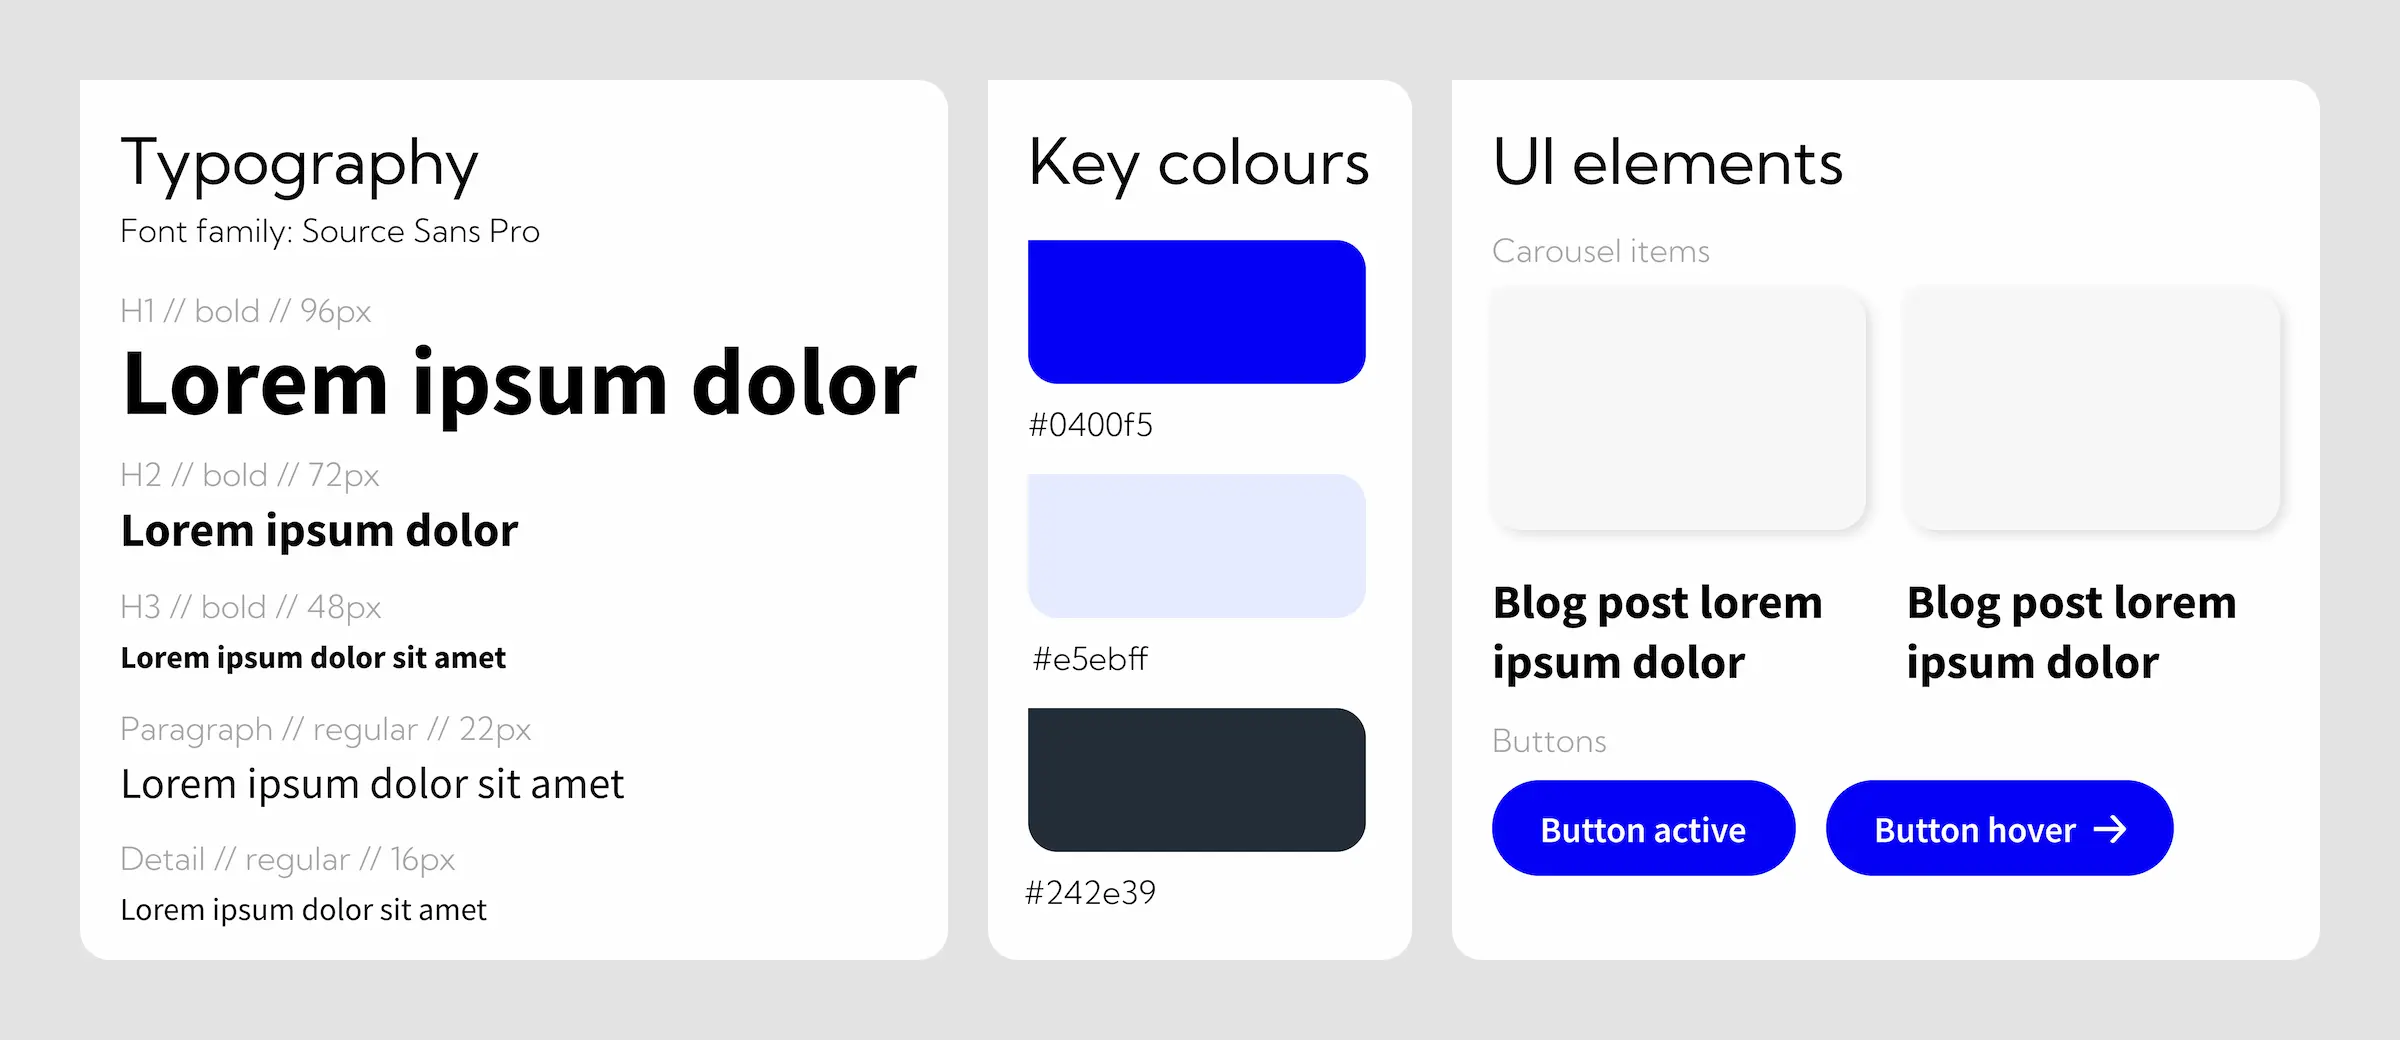
To ensure the research is truly 'owned' by the client rather than just received as a third-party report, I emulated their existing branding and UI patterns. My aim was to reduce the ‘visual friction’ of an external consultancy’s branding and increase stakeholder adoption by positioning the platform as a proprietary internal tool.
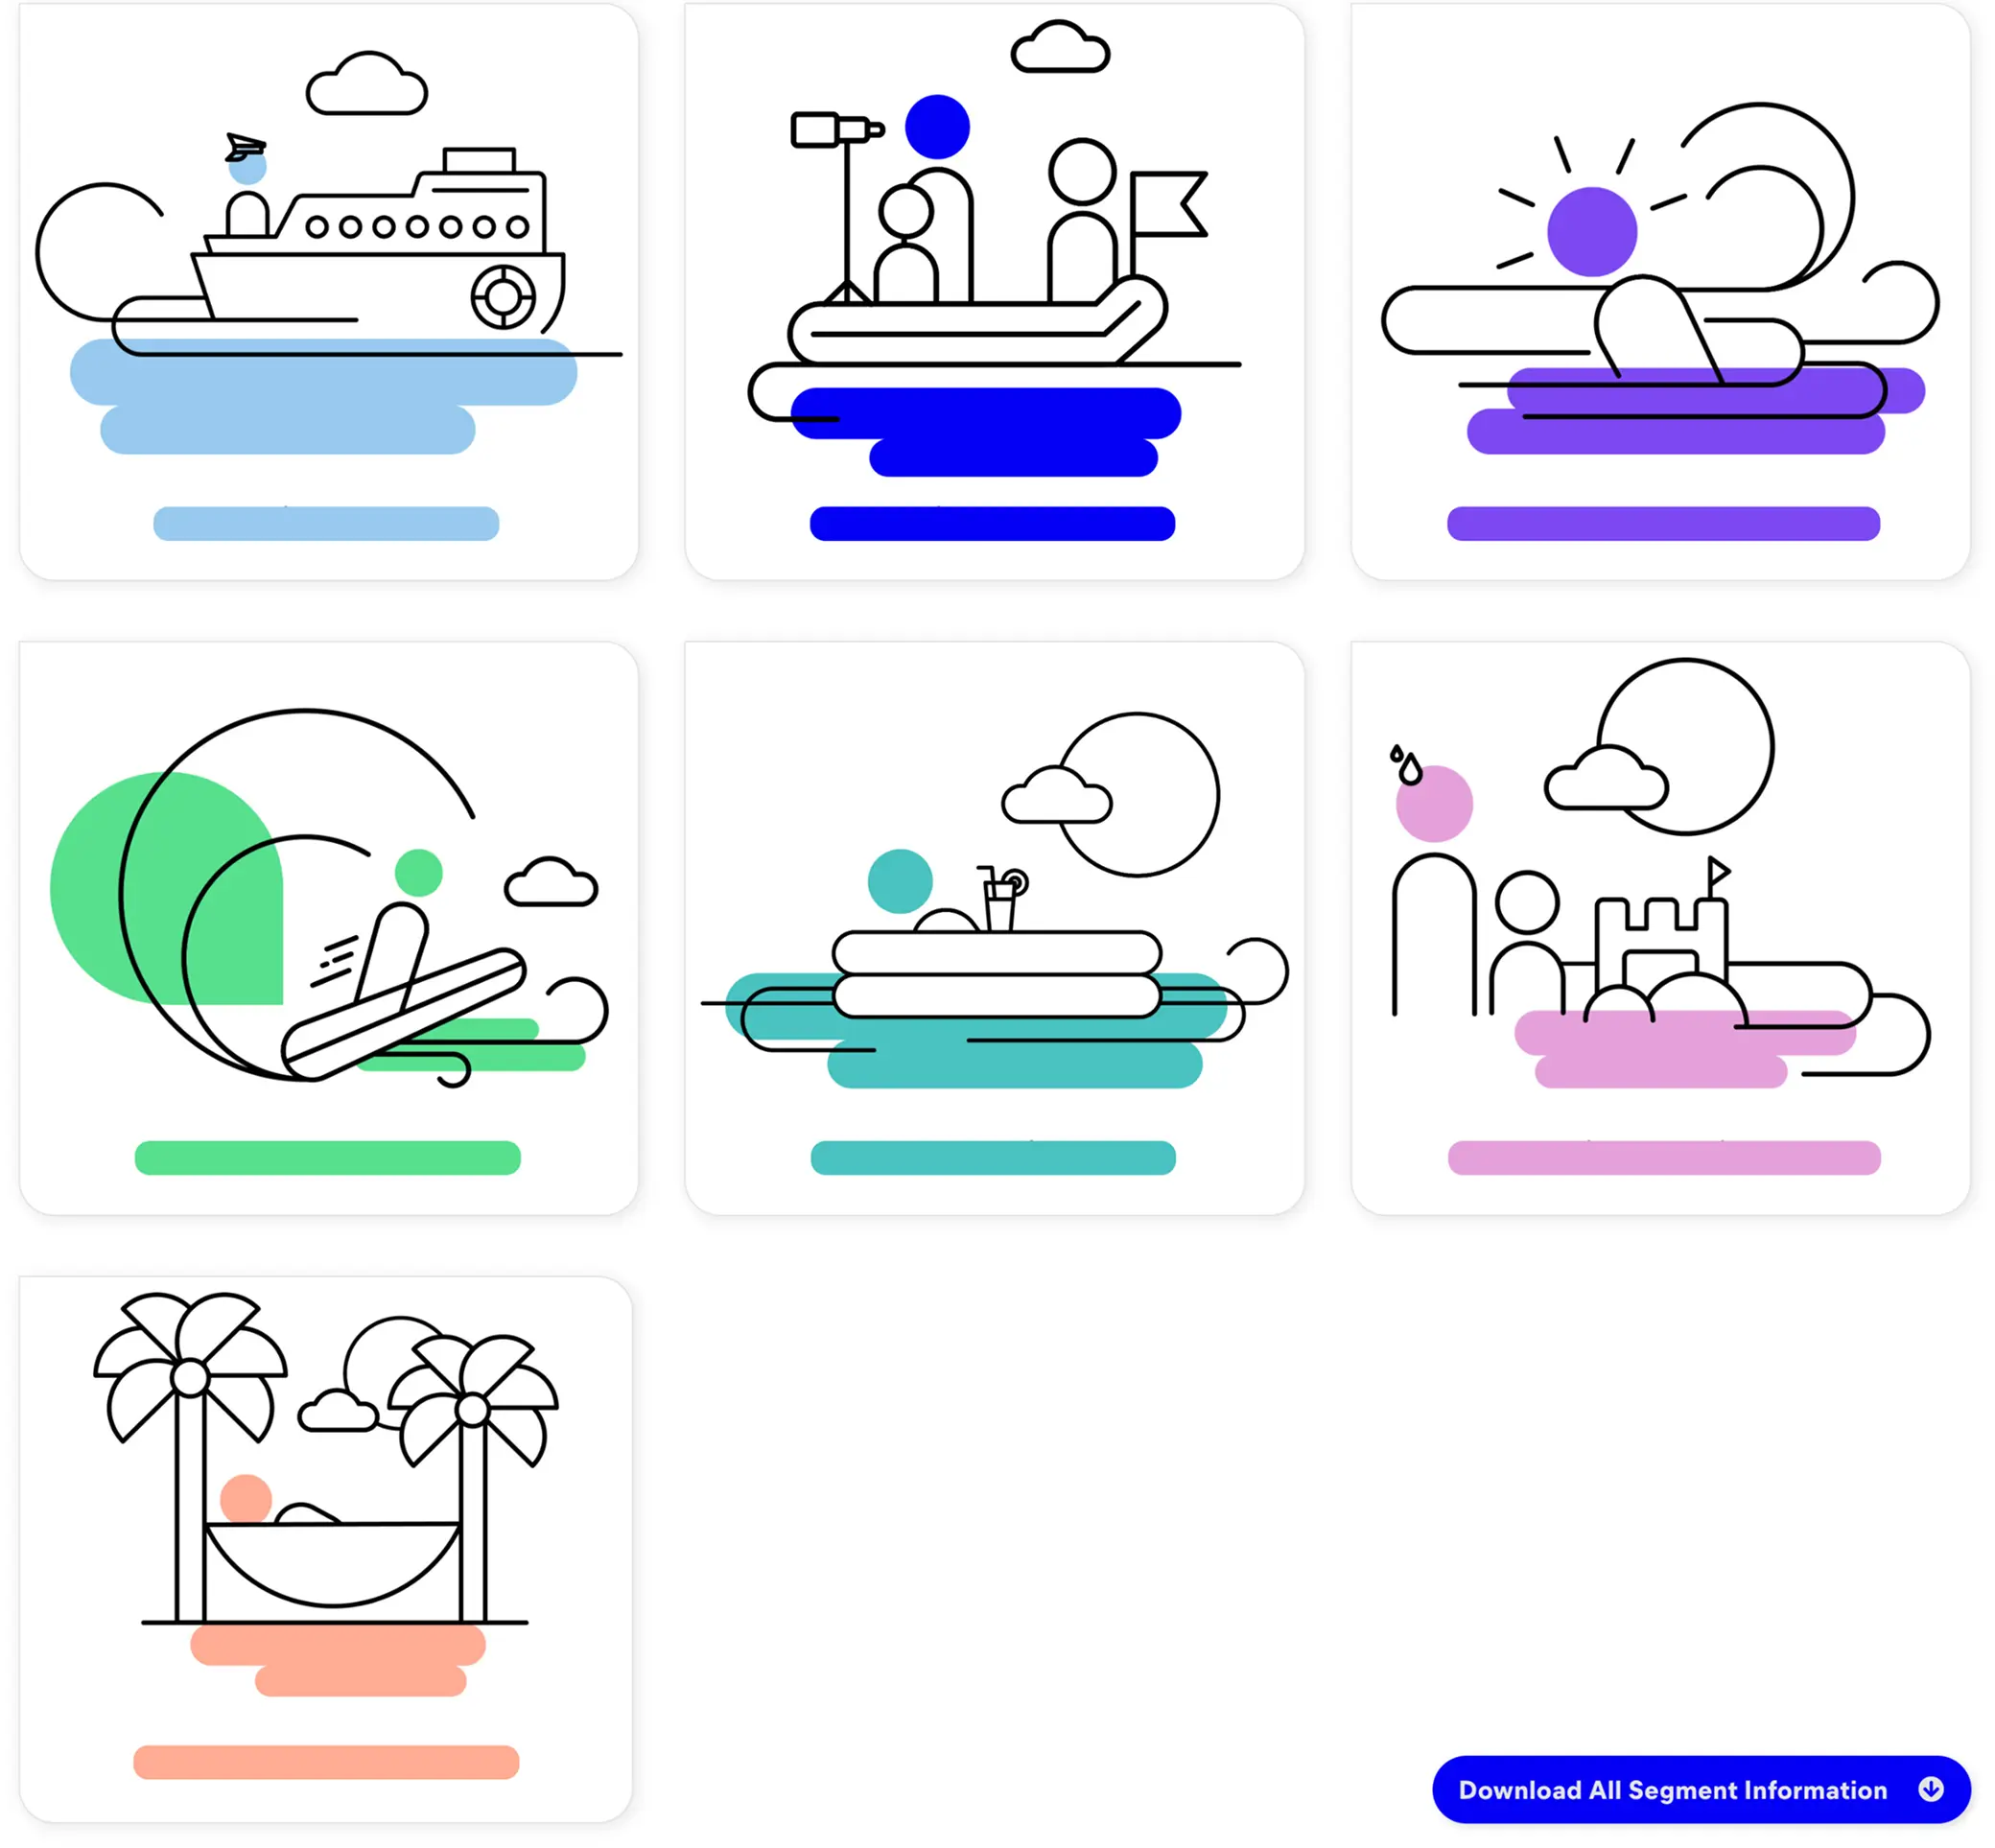
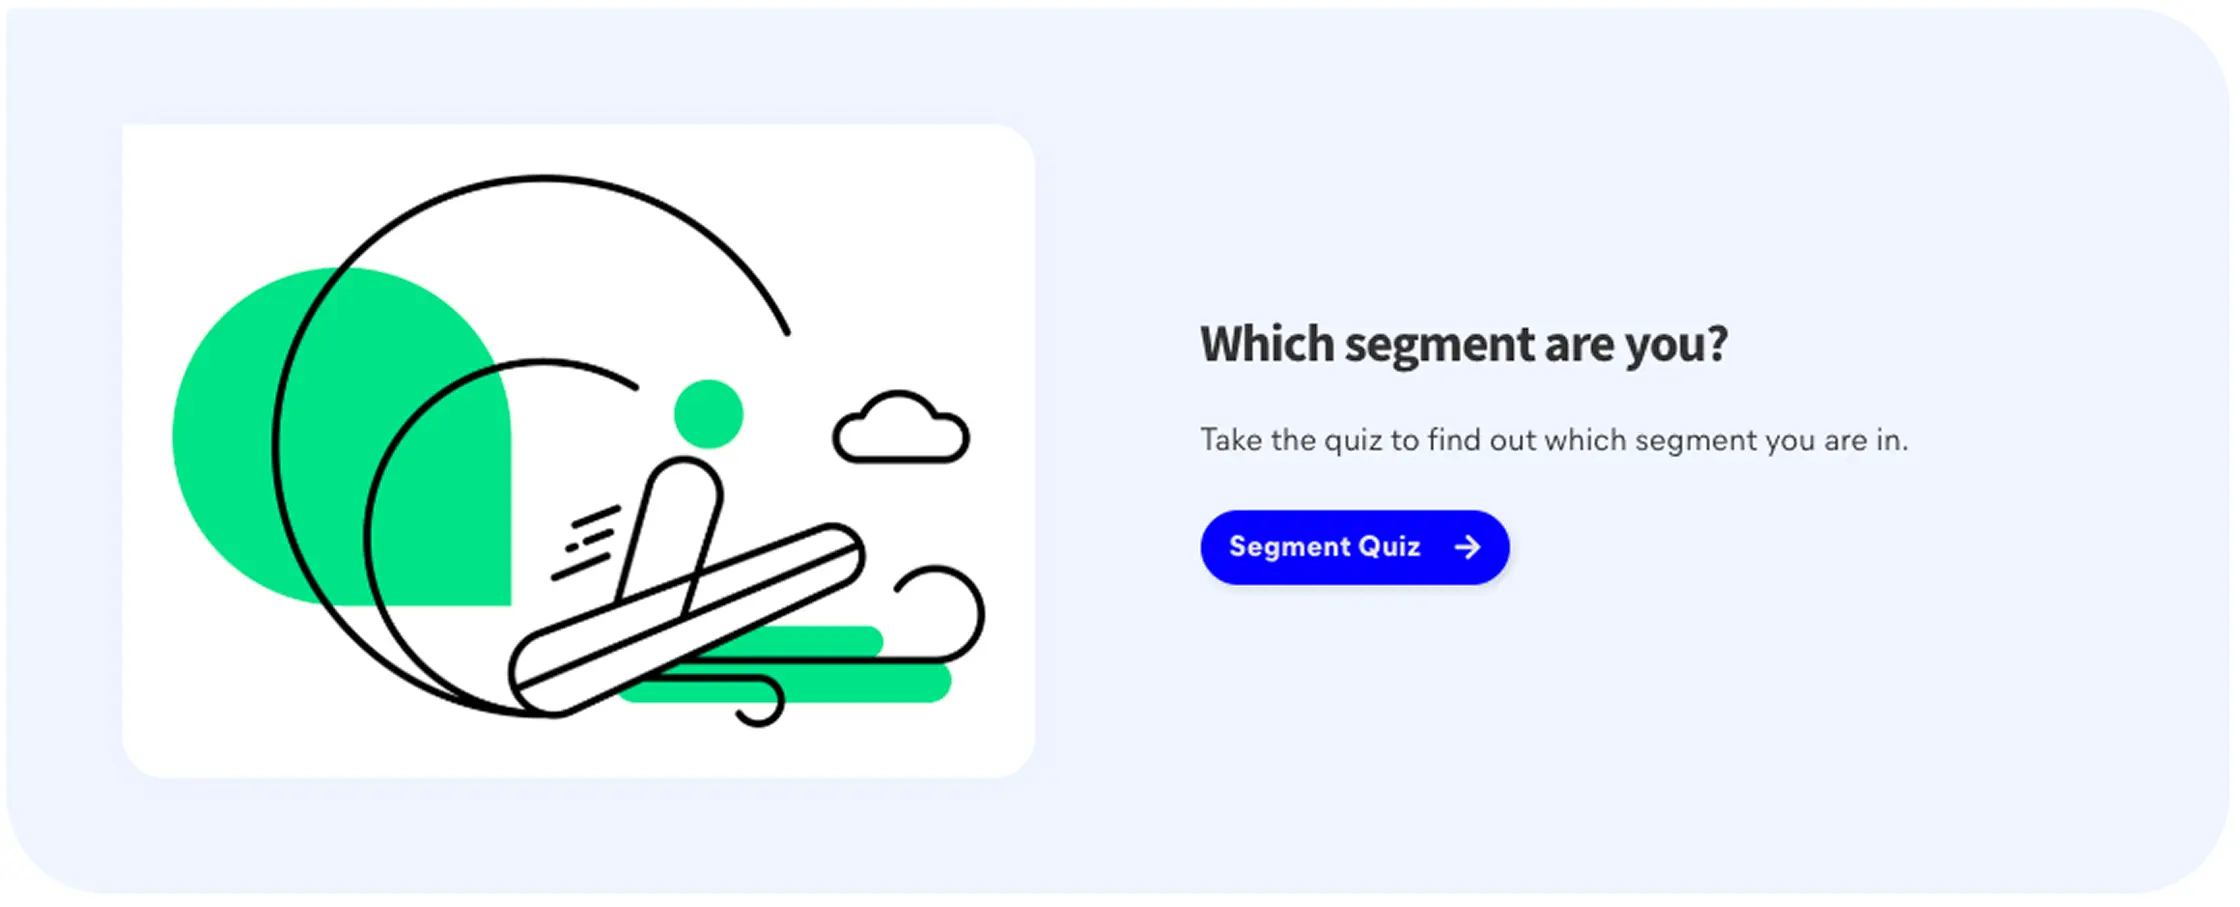
The site is structured with a two-tier hierarchy. The main landing page handles high-level engagement, featuring a video summary of research goals and the 'Which segment are you?' quiz. This leads to a secondary hub where all segments are displayed in a card-based grid layout , providing a condensed, scannable overview.
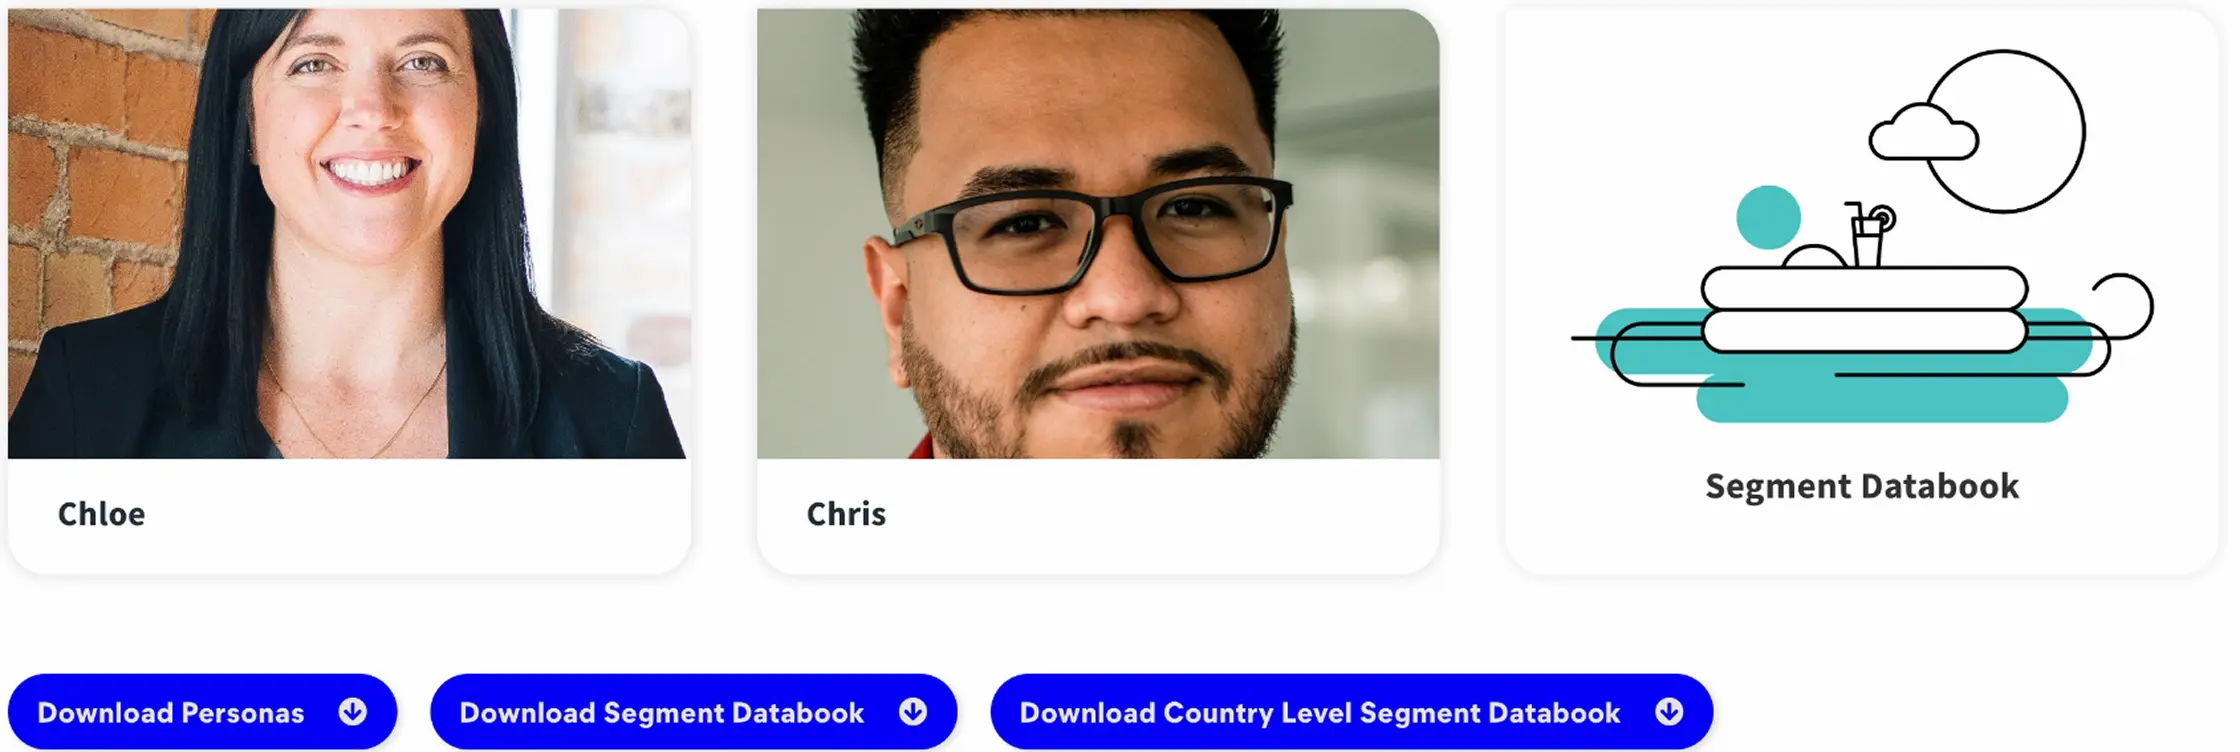
To ensure scalability, I developed standardized page templates that balance narrative storytelling (videos and personas) with quantitative data (interactive charts) and downloadable toolkits for use in internal decks.
Build
To support longer-term scalability, I developed the platform using WordPress, a CMS that offers robust user management and would give us the flexibility to invite named editors in to update the content independently.
I utilised the Elementor theme builder alongside Custom Post Types (CPT) and Advanced Custom Fields (ACF) to set up a truly dynamic system. This modular approach allowed me to map segment data to standardised templates, ensuring that global design updates would remain consistent across all seven segments.
For the data-heavy pages, I integrated ApexCharts.js to create interactive, responsive visualisations. This ensures that the quantitative data is legible and engaging regardless of device, providing a level of accessibility that a traditional PDF couldn’t match.